Running a GraphQL service for generating points
The Creating a Scan Spec tutorial shows how you would use the commandline client to
plot a Spec. This maps nicely to using scanspec in a commandline utility, but
not if you want to expose those points to a web GUI. To do this we will bring up
a GraphQL service that allows a web GUI to request the points it would like to
plot.
Running the server
In a terminal, run:
$ scanspec service --cors
======== Running on http://0.0.0.0:8080 ========
(Press CTRL+C to quit)
You can now open a browser to http://0.0.0.0:8080/graphql and see a GraphiQL editor which will allow you to send GraphQL queries to the server.
Note
All the examples below will embed a GraphiQL editor in your browser. If you
refresh your browser, they will contact the scanspec service you are running
and become live: you can modify the queries and press the play button to get
an updated response from the server. If the server is not running (or you
didn’t pass --cors to it) then the play button will not be visible.
Validating a Spec
The first use case for our service is producing the canonical serialization of a
Spec. Some of the Specs like Line.bounded will return an instance of Line that
has different parameters to those that are passed.
For example, on the commandline we might do:
>>> from scanspec.specs import Line
>>> Line.bounded("x", 0, 1, 5).serialize()
{'Line': {'axis': 'x', 'start': 0.1, 'stop': 0.9, 'num': 5}}
The equivalent in our service is:
Getting Points from a Spec
More important is the ability to obtain a list of scan frames from a Spec. GraphQL gives the user the ability to request one or more fields from an object, allowing them to obtain data that is relevant only to their application.
The ‘getPoints’ query makes use of this, giving users the ability to select from one or more of the following fields:
axes: a list of axes present in the Spec and its associated scan points
totalFrames: the total number of frames produced by the Spec
returnedFrames: the number of frames returned, limited by the maxFrames argument
smallestAbsStep: the smallest step between midpoints across ALL axes in the scan
Within axes:
axis: the name of the axis present in the Spec
lower: a list of lower bounds that are each present in a frame
midpoints: a list of midpoints that are each present in a frame
upper: a list of upper bounds that are each present in a frame
smallestStep: the smallest step between midpoints in this axis of the scan
Within lower, middle and upper:
string: returns the requested points as a human readable truncated numpy formatted string for debugging
floatList: returns the requested points as a list of floats
b64: returns the requested points encoded into base64
Using the example above, we can request to return points from it:
Masking a region of a spec
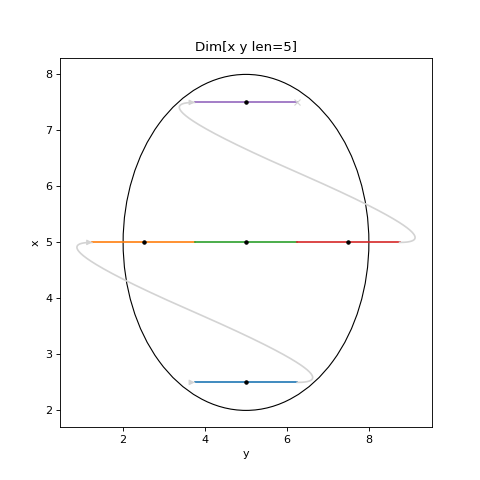
Regions can be used to mask a Spec as described in Creating a Scan Spec. Consider the following spec:
# Example Spec

from scanspec.plot import plot_spec
from scanspec.specs import Line
from scanspec.regions import Circle

spec = Line("x", 0, 10, 5) * Line("y", 0, 10, 5) & Circle("x", "y", 5, 5, 3)
plot_spec(spec)
(Source code, png, hires.png, pdf)

We could query the service for the points information like so: