scanspec.plot#
plot_spec to visualize a scan.
Members
Plot a spec, drawing the path taken through the scan. |
- scanspec.plot.plot_spec(spec: Spec[Any], title: str | None = None)[source]#
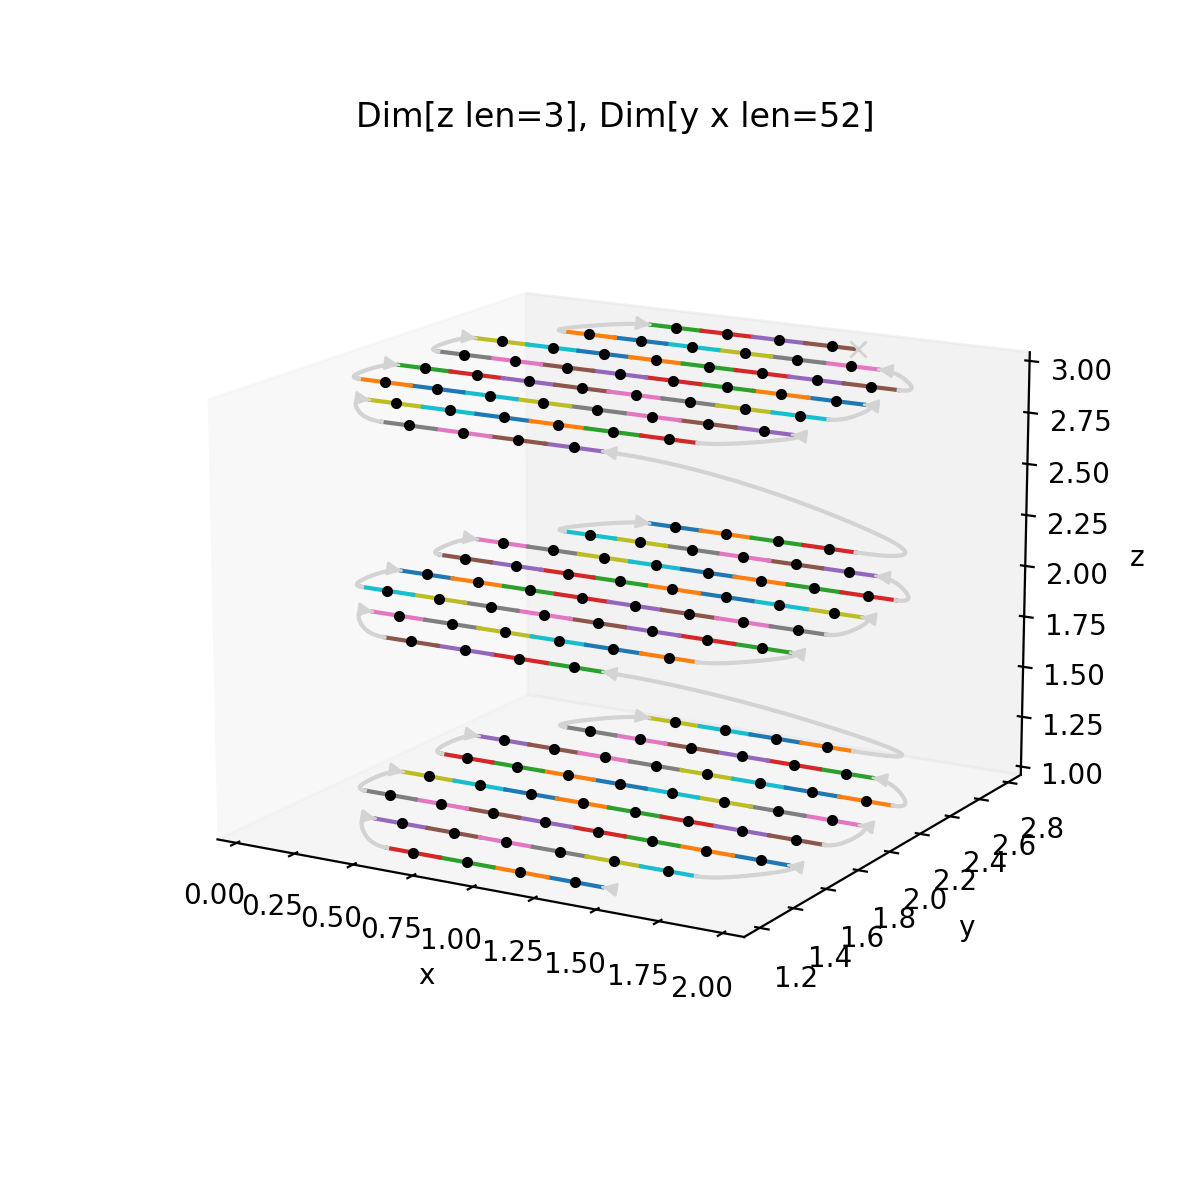
Plot a spec, drawing the path taken through the scan.
Uses a different colour for each frame, grey for the turnarounds.
# Example Spec

from scanspec.plot import plot_spec
from scanspec.specs import Linspace, Ellipse

spec = Linspace("z", 1, 3, 3) * Ellipse("x", 1, 01.8, 0.2, "y", 2, snake=True)
plot_spec(spec)
(
Source code,png,hires.png,pdf)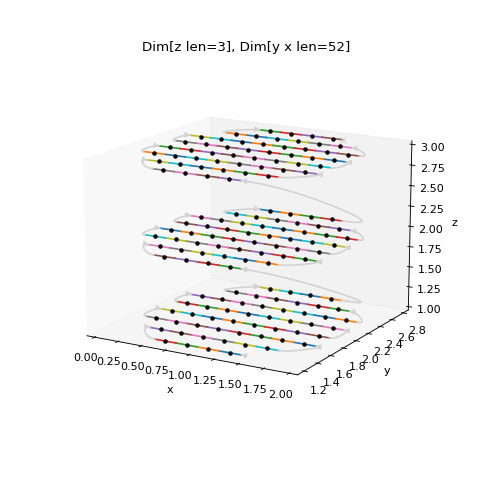